Features, Features, Features
Website Monitoring Magazine
 Dieser Artikel existiert auch in einer deutschen Sprachversion
With koality.io we have created one of the most comprehensive monitoring solutions on the market. Extensive, because we have set ourselves the goal to cover all areas that are important for the success of a web project. But if there is one thing we have learned from Spiderman, it is that with "much scope comes much responsibility". That's why we've thought of some features that make using koality.io as easy and pleasant as possible.
Customer overview
We work together with Agencies very much. So it's important not to lose track even if you have dozens of customer projects in the monitoring process.
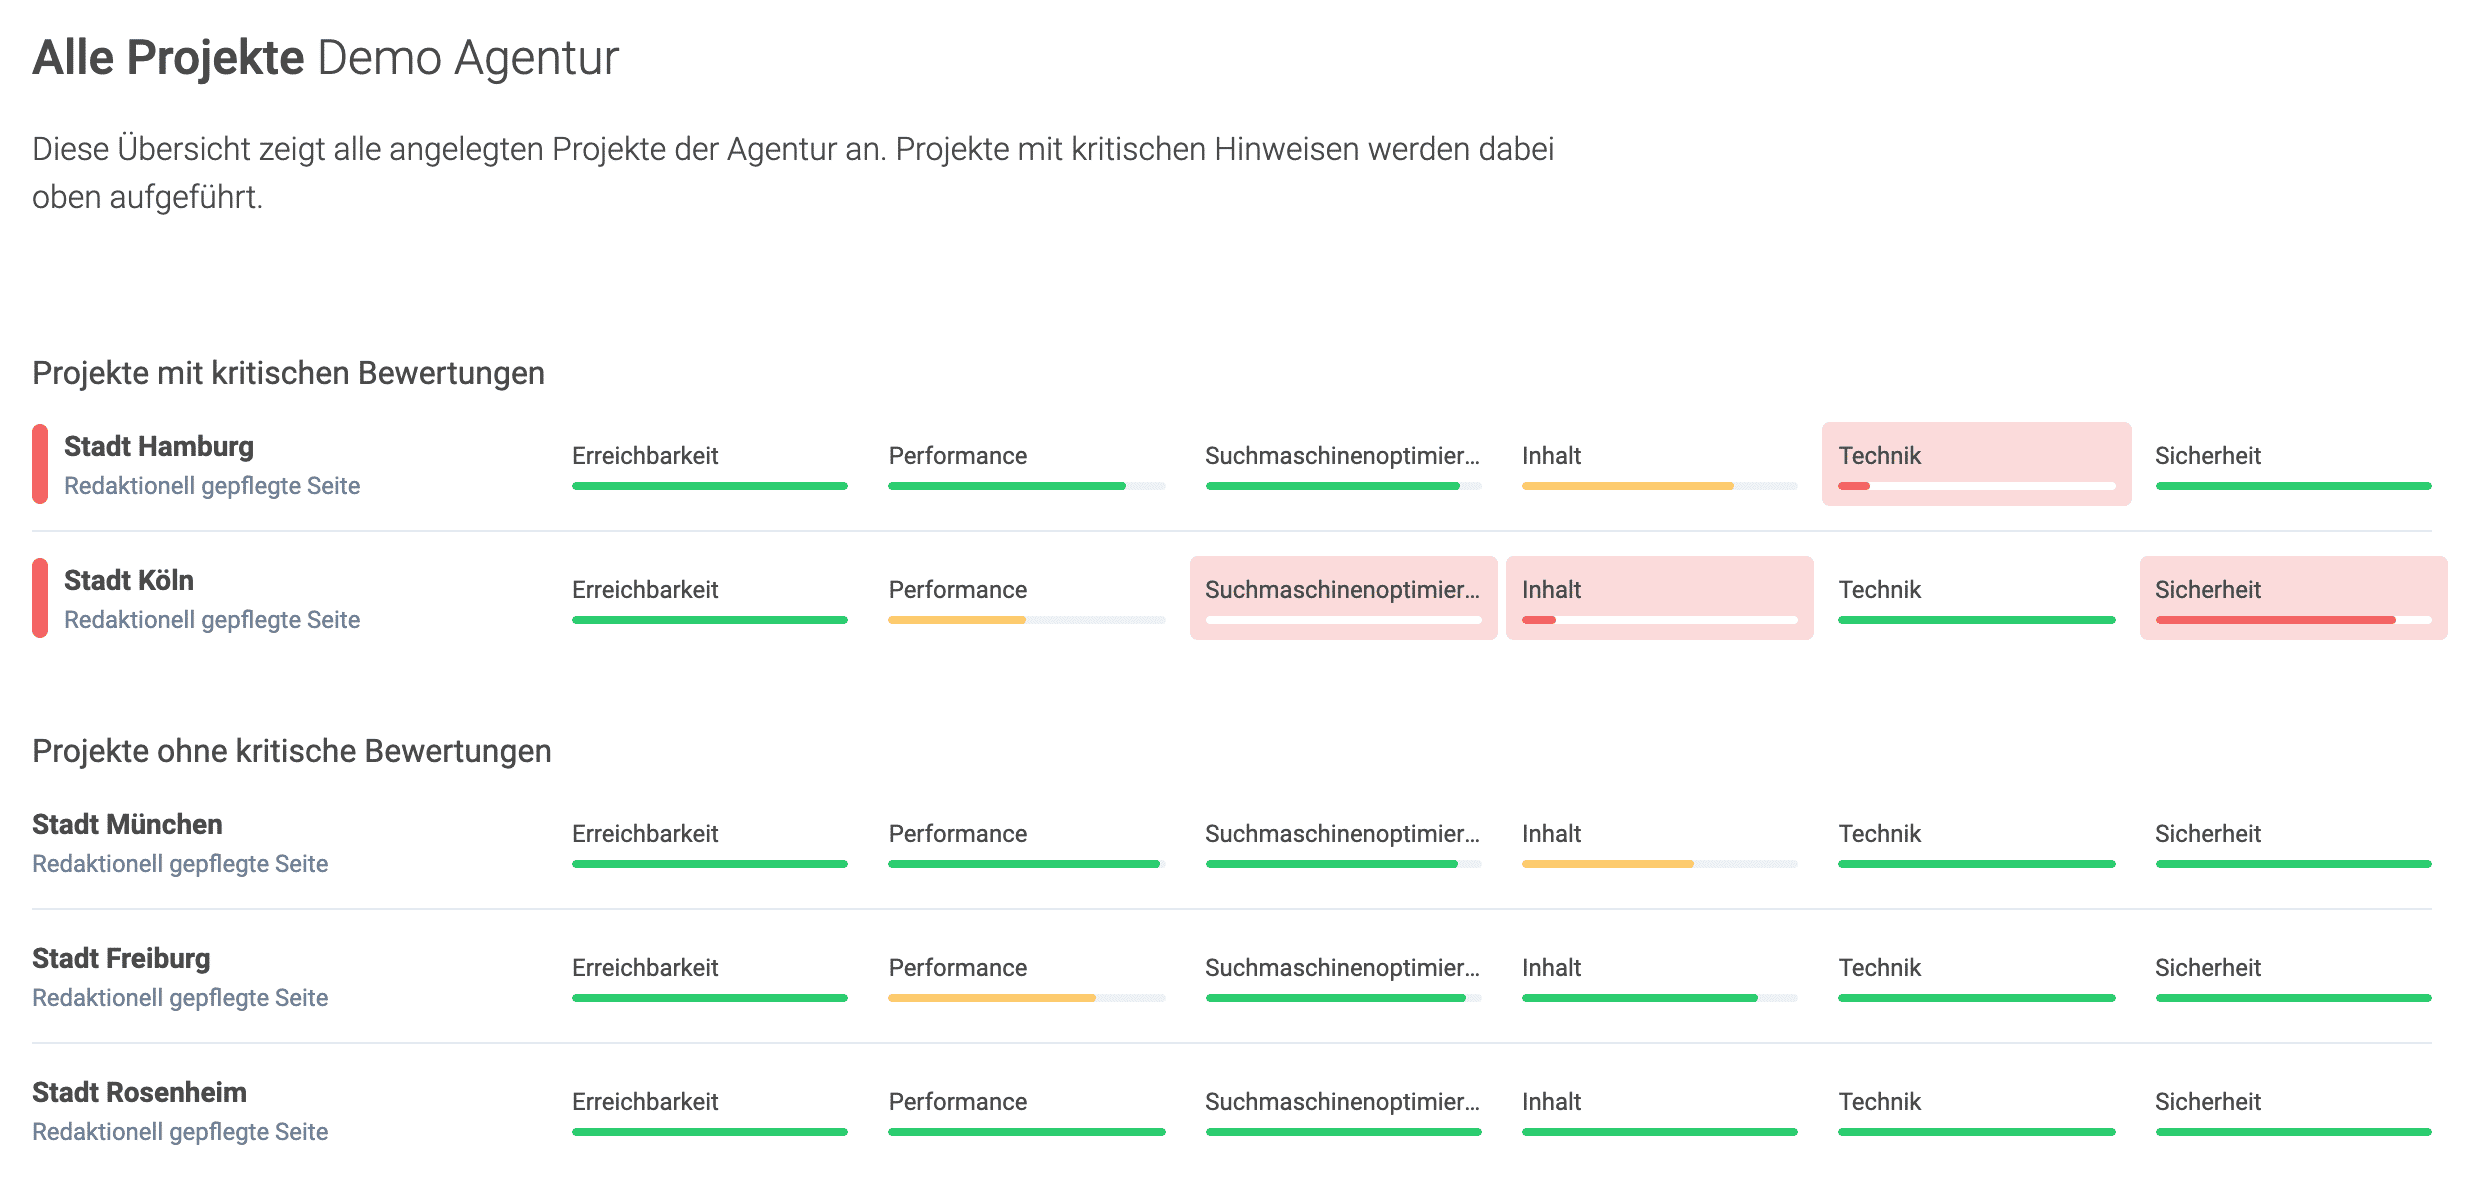
We have decided to display all important values already in the overview page. This includes accessibility, performance, SEO, content, technology and security. Additionally we group all projects in which something critical has just been found. This way we make sure that the user can set the focus correctly.
Project Management View
We have decided to offer several perspectives on a project. Monitoring can be very extensive and detailed, but as the person in charge you just want to know if the values are good or not. koality.io offers three levels of detail.
-
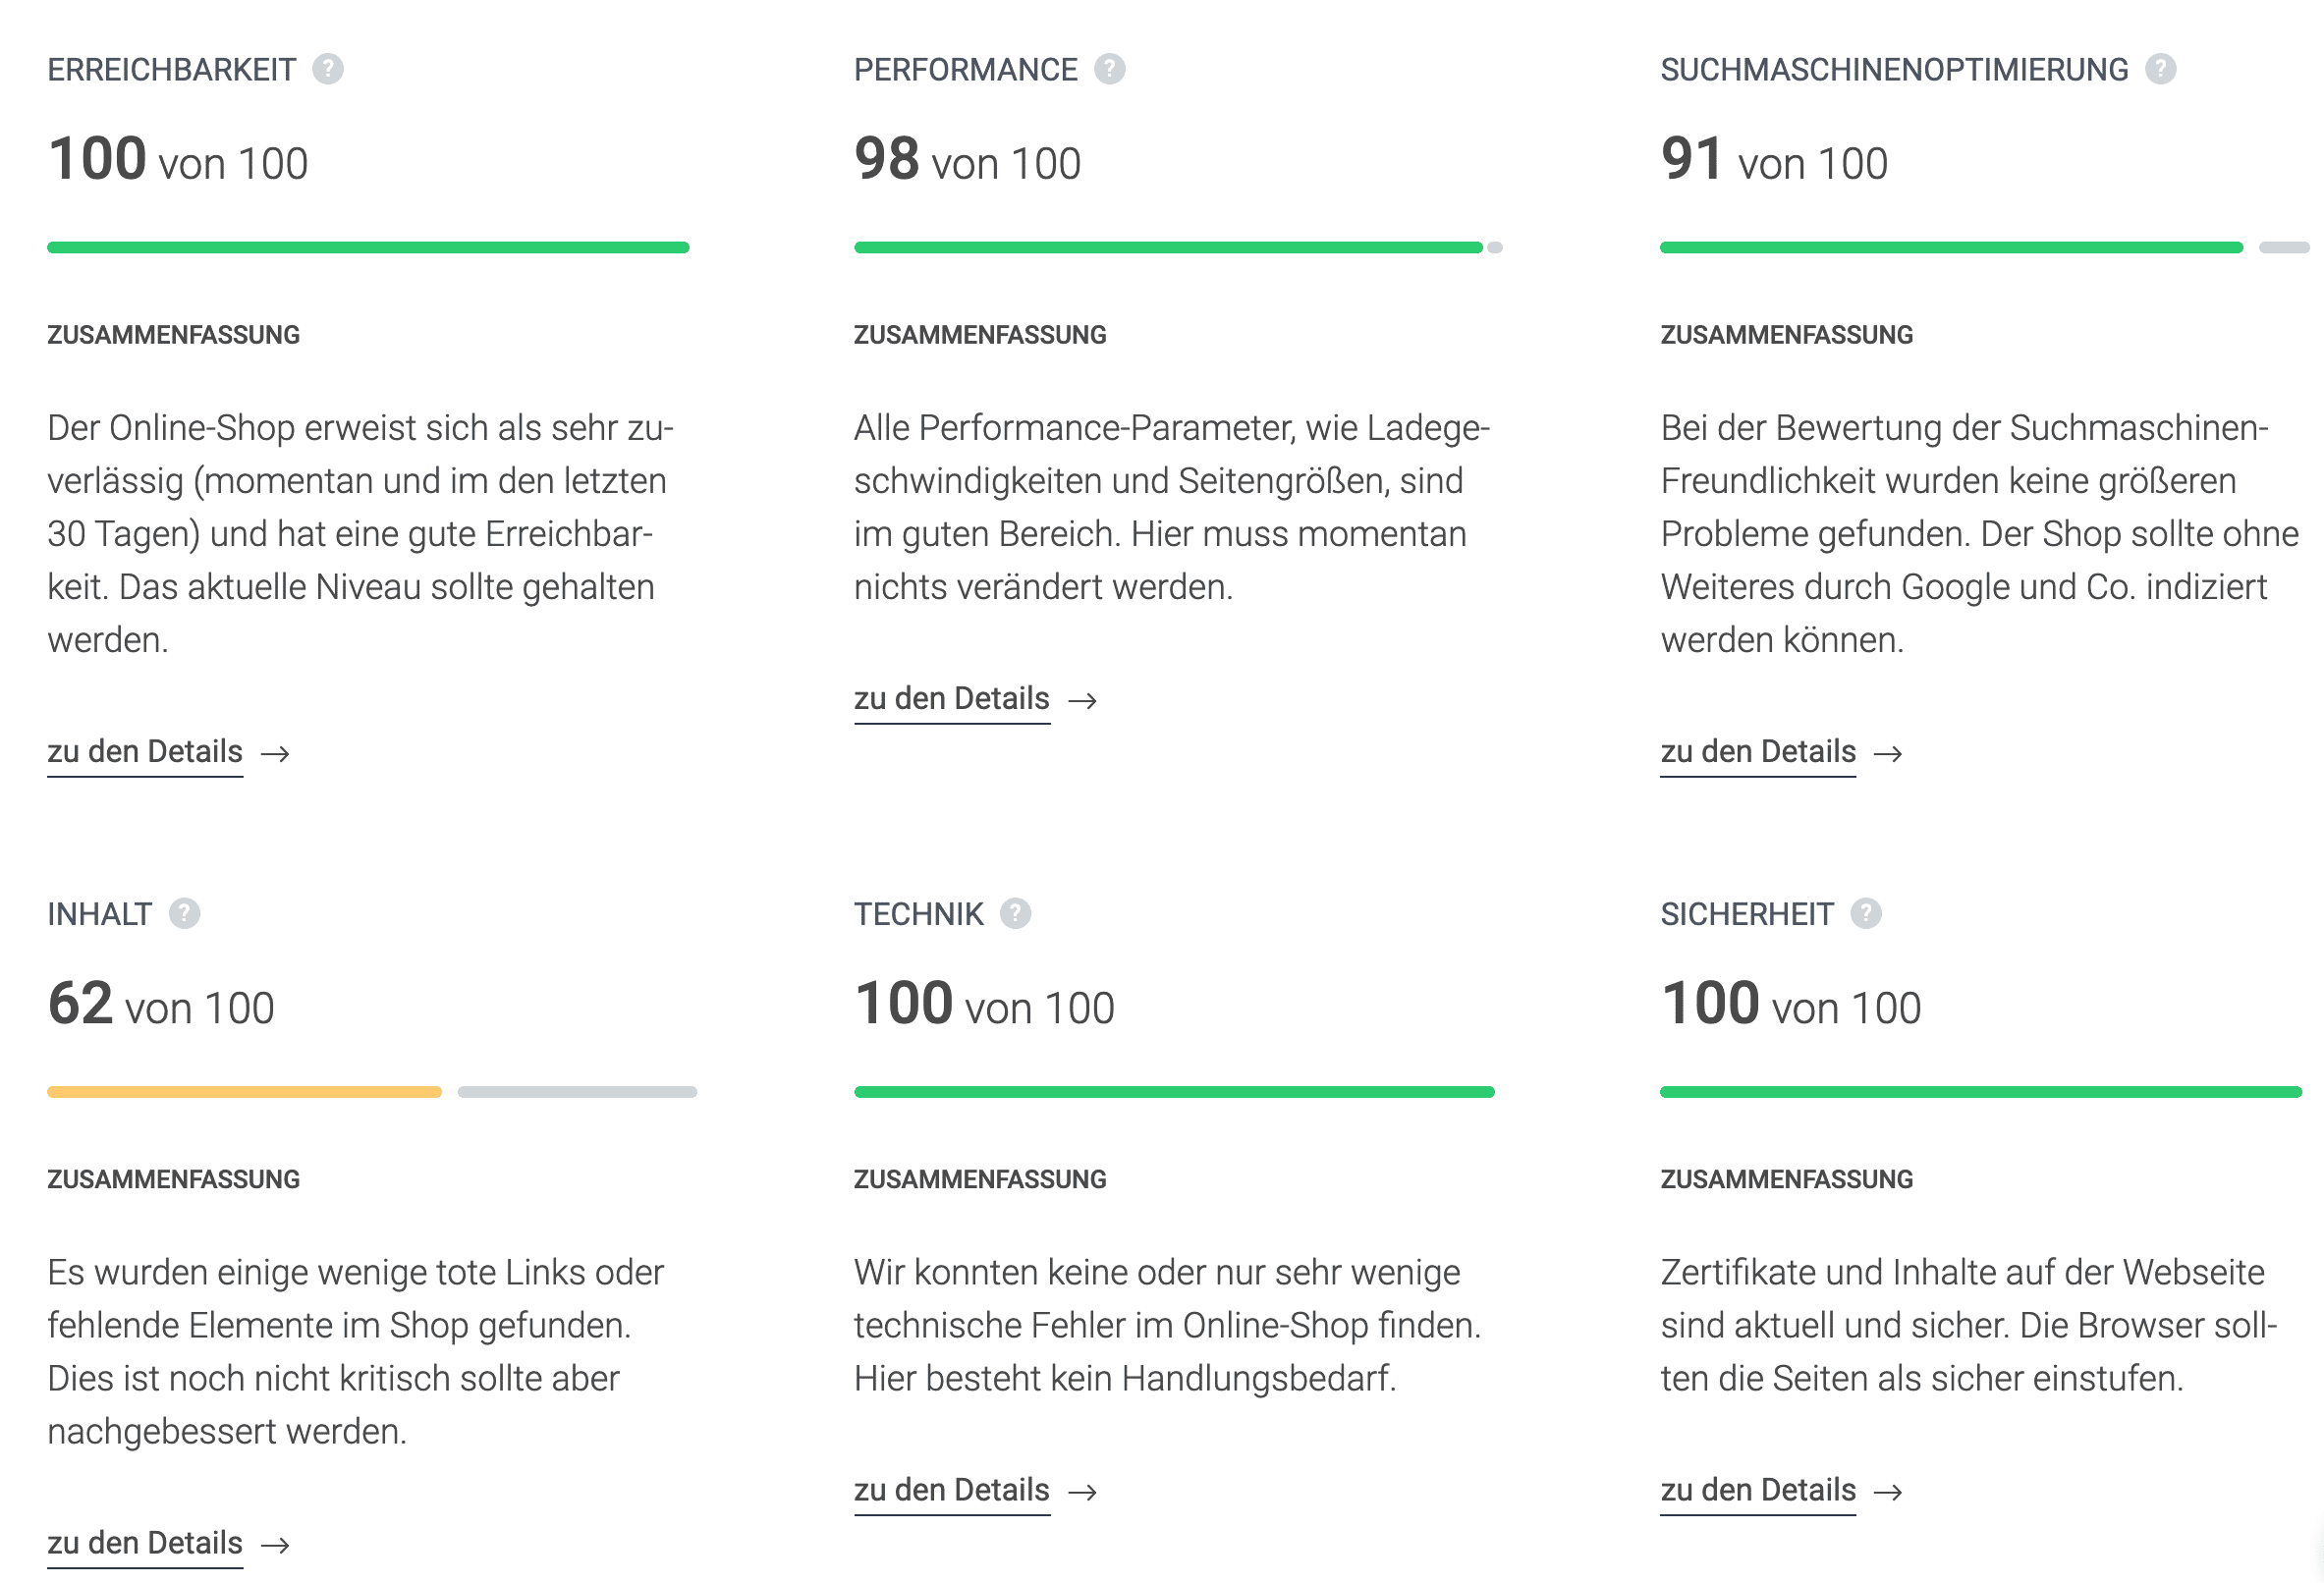
Project Management (PM) or Executive view: In this view we "only" provide the summarized values for our six pillars. Here, for example, we talk about performance. If the value is good, it is perhaps important to know that it is a composition of many individual measurements. However, how the value comes about exactly is not important at the moment. In this view, it was important for us not to throw technical terms around in order to maintain general comprehensibility.
-
Detail view: Here we dissolve the grouping. Performance here, for example, is no longer simply performance, but a combination of server load times, browser load times, page sizes, number of large elements and Google Lighthouse performance. Here is always the current status and again on a scale from 0 to 100.
-
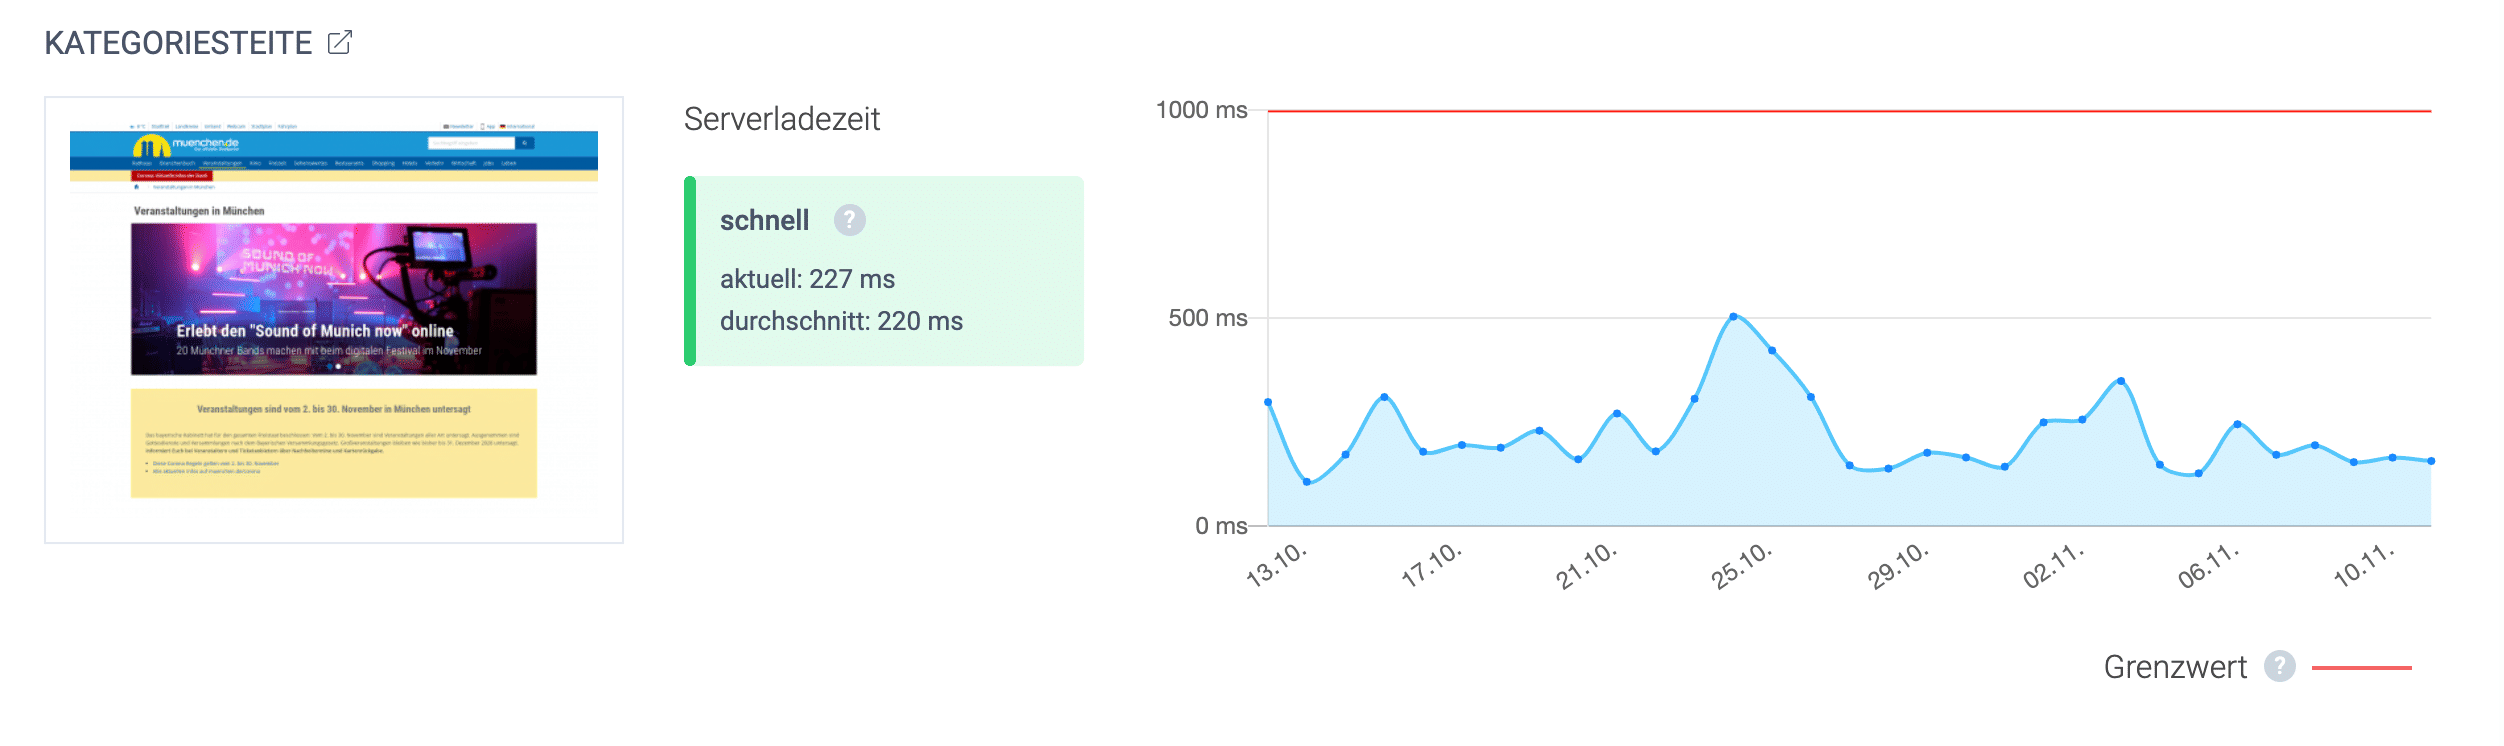
Historical data: The third view contains the highest level of detail. Here we find all historical data about the last month. Additionally this is the level where we change from the 0-100 scale to the "real" values. Here we show the milliseconds it takes the most important pages to load.
History
We collect and visualize all important data of the last thirty days. Additionally we offer the possibility to read out the data of the last year via our API.
In addition we also offer the complete error messages of the last days in a table overview.
Find URLs automatically
Thanks to our Component Finder, it is possible to set up entire projects within seconds. koality.io automatically searches for all important websites of a project. The following video shows exactly how this works:
Set up a new project in 39 seconds
Alerting
Alerting in case of failure is one of the most important features of a website monitoring system. There are a few things to keep in mind. koality.io sends alert messages via email. Whenever an error occurs, but also when it happens again. This way we can make sure that not too many alarms go out and still get all the important e-mails.
In addition, we offer another important feature: the criticality of the individual errors found. Thereby koality.io knows two types of errors, critical and moderate or light errors. Alerts can be set to send critical errors immediately, moderate errors only once a day in a grouped email. This is also the default setting, which we recommend.
Coming soon
Even though koality.io is already one of the easiest to use and most comprehensive website monitoring tools available, we still have a lot more to do. Since transparency is also important to us, the following article presents our vision for the next months.
- Vision 2021 // LINK auf den Medium Artikel